
We use projections to provide a forecast of financial performance based on historical data, market trends, and other factors. Well-designed projections help institutions prepare for adverse economic conditions, ensuring they can navigate potential challenges effectively.
Once we’ve created our projections, as in an earlier article, we need to stress test the assumptions behind the numbers. This ensures they are reasonable based on the goal of the projections. For example, if we want the projections to provide the “most likely” outcome over the next 5 years, we need to do the stress testing from this perspective. Conversely, “worst case” projections would be stress tested from that perspective. I recommend focusing on “most likely”.
The goal is to identify vulnerabilities and create clear alignment on the KPIs necessary to achieve success (as defined by the projections). Stress tested projections provide a base for management to monitor outcomes and respond to changes quickly, ensuring stability. To help management and the board focus on KPIs, I color code the risk rating of each one. I use red, orange, yellow, and green. Red is high risk, green is no risk, and orange and yellow are in the middle. I do not like to reflect red (high risk) for any KPIs as it assumes we do not agree on the strategy. Remember the goal is most likely, not best case. In the current market, it is likely that all enrollment related revenue and KPIs would be yellow or orange at best because of the market uncertainty.
Stress testing projections offers several advantages:
- Helps institutions mitigate risks by identifying vulnerabilities in assumptions
- Enables better financial planning and risk management by providing clear performance assumptions
- Highlights strengths and weaknesses in an institution’s financial position.
Approach to stress testing
Stress testing is performed using a combination of external and internal information as indicated below. Understanding internal information requires significant conversations with the managers responsible for the performance indicators for each line item. The goal is to understand why management believes they will achieve the outcomes used in the projections. Does the historical data support these outcomes? Are these outcomes supported by market data? If not, what specific actions will allow the institution to achieve these outcomes? This requires the ability to challenge management’s assumptions and push back where assumptions may not be supported by planned actions. The goal is to help management succeed by ensuring the underlying assumptions are clearly understood, projections are achievable, and specific actions are linked to each assumption.
Major stress testing factors
While some factors are unique to each institution, there are major factors which generally apply:
Inflation factors like revenue and expenses increase over time. We should assume tuition charges, expenses and compensation inflation is closely tied to CPI (consumer price index) predictions as expenses increase over time.
Variable factors tie directly to changes in volume, like number of students or number of staff. Net tuition revenue, food cost, and employee benefits are primary examples.
Incremental factors increase in varying levels like a staircase. At what increase (or decrease) in volume will the expenses change? Examples include maintaining a 15 to one faculty student ratio, or housing capacity.
Fixed factors generally do not vary with volume. These often are things like senior leadership teams, or debt service. Many of our expenses do not change with small volume fluctuations, except for inflation.
New initiatives are easiest to evaluate when they stand alone because we can look at revenue and the additional cost necessary to support the new activity. Layering them into projections enables you to monitor the anticipated outcomes of new initiatives and scale them up or down based on actual results.
Market forces are largely beyond our control and difficult to anticipate or try to hedge against. In the current environment, these are significant factors related to enrollment and discount, international enrollment, and grant revenue. Post pandemic, we have seen significant changes related to increased compensation pressures. Market forces are always at play when it comes to investment market impact on our endowment spend. The goal is to monitor the significant market forces and think about where they are likely to go to try to hedge against the risk.
Artificial intelligence is still a large unknown market risk. We consider leveraging it to reduce our staffing or process risk for routine activities, but many highly resourced institutions leverage it for enhanced student recruiting experiences.
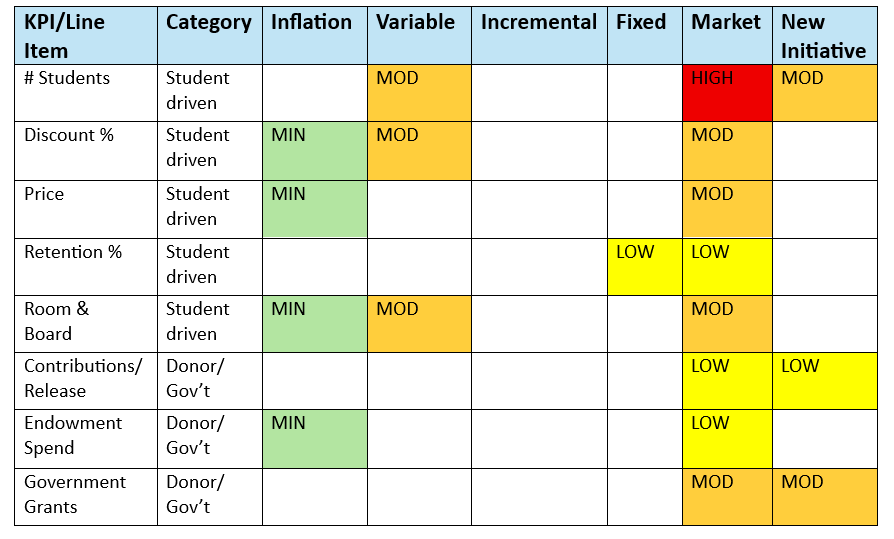
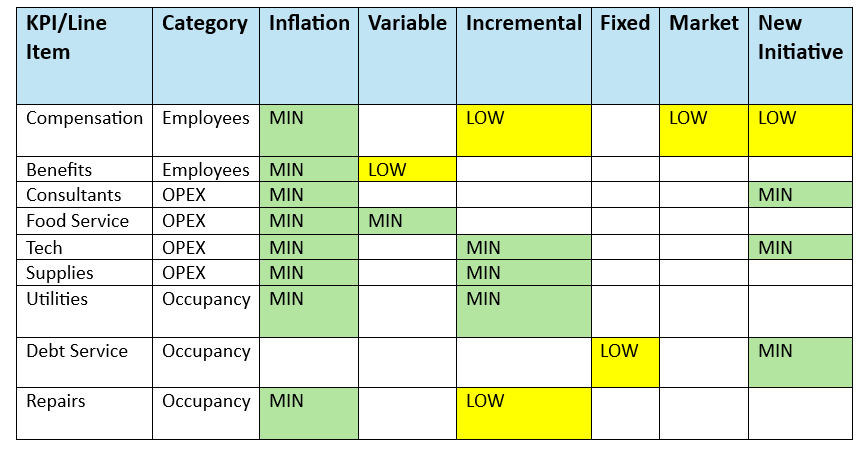
Below is a sample chart of risk rating for stress testing projections based on the factors above:
Risk Rating for Stress Testing: Revenue
Risk Rating for Stress Testing: Expense
Check back next month for a deep dive exercise on stress testing projections.
Photo by Douglas Lopez on Unsplash