
Last month, we talked about the six most important financial questions a board and president need to understand and the financial tools you need to answer them. Now it’s time to focus on the answers to those questions, the decisions they require, and the metrics you should examine to understand the drivers to financial sustainability. Your leadership team can use these metrics to get on the same page for the hard work ahead.
The six questions
As a reminder, the six financial questions that university leadership needs to ask are:
- Did we base the budget on the entire picture?
- Have we reconciled operating net income to cash flow?
- Have we forecast to year’s end?
- Did we build out five-year projections?
- Did we calculate cash and cash reserves (operating liquidity)?
- Can we right-size our institution?
Hopefully you were able to answer yes to the first four questions. Let’s talk about what to do with your five-year projections, operating liquidity, and metrics for right-sizing your institution.
Five-year projections
Your answers to the first four questions let you create an accurate five-year projection and understand how significant your deficit is likely to be in the next four years. I suggest calculating the amount of your deficit divided by the total operating expenses. This will tell you how much you need to cut expenses and/or increase revenue.
It can be difficult for educational institutions to cut expenses. Including third-party contracts, people represent about 70 percent of most institutions’ budgets. Another 20 percent is related to facilities — it’s almost impossible to reduce facilities costs without taking on the challenging task of reducing your campus footprint.
Whatever your deficit is, most of addressing it will involve reducing your workforce, unless you have other revenue sources. For an institution facing a 15 percent deficit, that would mean reducing your workforce by 25 percent! If that sounds impossible, it should. Cutting that many heads from your staff is not an easy task.
However, increasing revenue is not much easier for most institutions. New program launches take at least two years and often require hiring (and paying the salaries of) new faculty.
Operating liquidity
How long do you have to fix your deficit before you run out of cash? Your operating liquidity lets you calculate that. Your operating liquidity is your unrestricted net assets minus the fixed (capital) assets net of the related debt. We subtract these assets because it’s hard to sell a building to convert into cash.
The annual deficits reflected in your five-year projection let you figure out how many years you have before you run out of operating liquidity. For many small institutions, operating liquidity is already negative — they are borrowing from restricted funds, perhaps unintentionally.
Next, you need to understand what percentage of your restricted funds you have borrowed. To calculate that, divide your unrestricted liquidity (if negative) by your donor-restricted net assets.
This number is important! Once an institution borrows 25 percent of its restricted funds and continues to run deficits, it has about a 50 percent chance of survival, if it moves quickly to close the deficit. Institutions that have already borrowed 50 percent of their restricted funds are unlikely to survive and typically announce closure within a few years.
What metrics should we look at to right-size our institution?
If your institution is running deficits, you must make some critical decisions. The liquidity calculation helps you understand how long you have to make those decisions. While metrics should be customized to your situation, there are some measures that every institution should examine. These metrics are easy to calculate because the information for them comes from your audited financial statement.
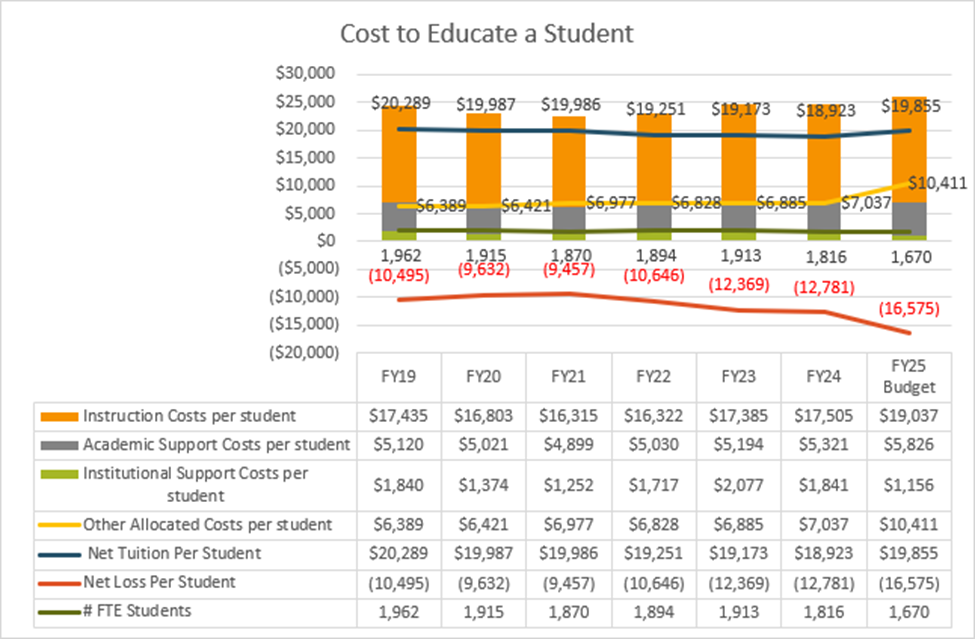
Metric #1: margin on education
In this example, net tuition driven by discount is the issue. Most of that discount is not funded. There was also a drop in enrollment, causing the per-student cost to rise quickly. The big question is whether enrollment will continue to decline.
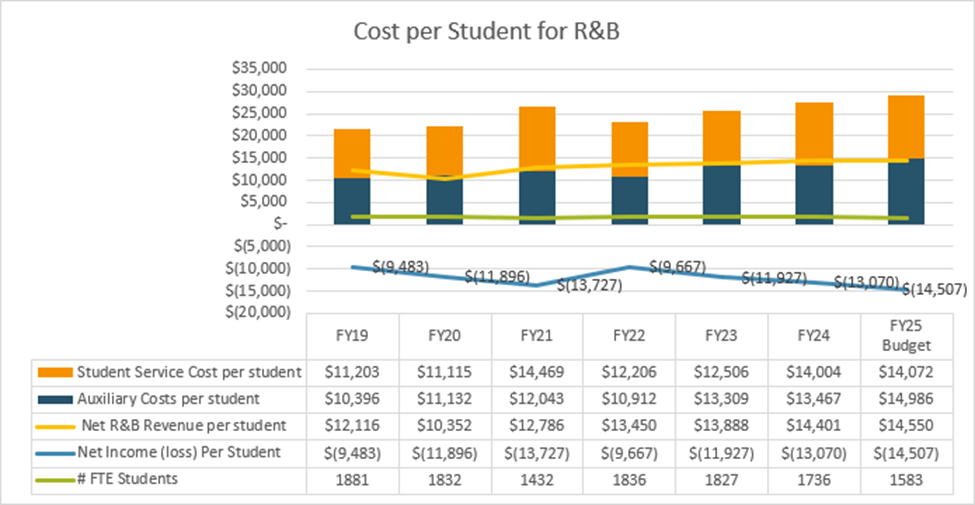
Margin on room and board
Again, the decrease in enrollment is driving up the per-student cost. But you can also see increases in both auxiliary expenses and student services. The data tells us that these costs increased, but we need to look at the internal data to understand why. In this case, the cost increase came from capital projects and food service, as well as student services related to mental health, athletics, and enrollment.
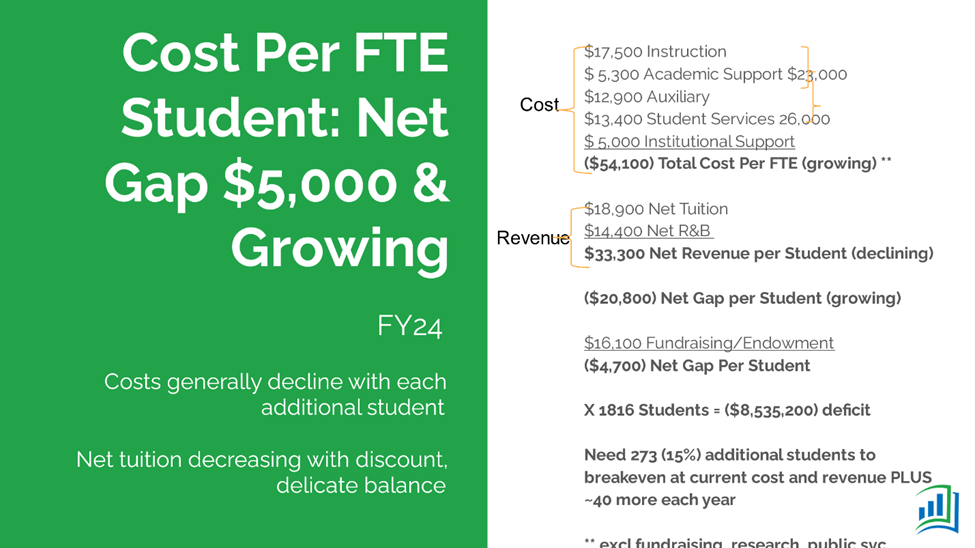
If enrollments are likely to increase, there may be little desire to cut costs, but for most institutions, the likely decline in undergraduate enrollment causes a need to seriously consider cost reductions.
For this institution, it costs $54,000 to educate and house/feed each student. The net revenue per student of $33,000 leaves a gap of about $21,000 to be funded by fundraising and endowment. In this example, this still leaves a gap of almost $5,000 per student, resulting in an $8.5M deficit. The deficit is growing as costs go up and enrollment declines.
The biggest mistake I see institutions make is to treat margin analysis as an exact science. After spending one to two years arguing the nuances of cost allocations, they make no progress and scrap the entire project. This analysis is not an exact science. Many could argue that student services are not strictly related to living on campus. This is true, but if you are a largely undergraduate school with most students living on campus, it is “directionally correct”.
In cases where you have significant graduate programs, you may need to allocate the costs based on full-time enrollment for undergraduate versus graduate, but I encourage you to perform the analysis in a directionally correct way, rather than getting hung up in the nuances of exactness. If you are currently running deficits, you don’t have time to create a perfect analysis – you need to take action soon.
A margin analysis is enlightening for most institutions, since it shows the leadership team where the revenue and expense drivers are. It also helps them think about where to spend their energy on cost reduction.
What to do with college and university right-sizing metrics
We will dive deeper into this exercise next month. Think of right-sizing your institution as peeling back the layers of an onion. You start by analyzing the outer layer, then you follow the clues to analyze the next layer.
If we think student service expenses are high, we’ll look at all departments in student services on a per-student cost basis to understand how much we are spending on each core activity. This allows us to figure out which activities we might need to reduce or overhaul. For example, an institution might cut the number of coaches per sport to reduce athletic expenses. Another might increase course sizes for certain departments. There are lots of options depending on what your analysis uncovers, so stay tuned.